There are two fundamental theories in biology: Darwin’s theory of evolution by natural selection and the cell theory, the observation that organismic life consists of one or more cells, the atoms of biology. Furthermore, all cells arise from previous cells by cell division, passing on their DNA source code in their genes in the process. Multicellular organisms have taken to this lifestyle with a vengeance, evolving into vast collections of highly diverse cellular communities that work together in a tightly coordinated manner across all organs in ways that escape our understanding and that make up a living being. A typical human body comprises an astounding 30 trillion cells (close in number to the dollars of the total U.S. debt), with fewer than 200 billion cells, under 1 percent, making up the central nervous system.
Focusing on the brain, microscopic observations by 19th-century anatomists provided the earliest description of distinct neurons that continue to be studied today: Betz neurons, Purkinje neurons, Meynert neurons and so on. The invention of dyes rendered their glorious complexity visible. The dyes stained with precision even cells’ far-flung components—dendrites, the tiny, filamentlike signal-receiving antennae; cell bodies, the neurons’ processing centers; and axons, the cells’ output wires.
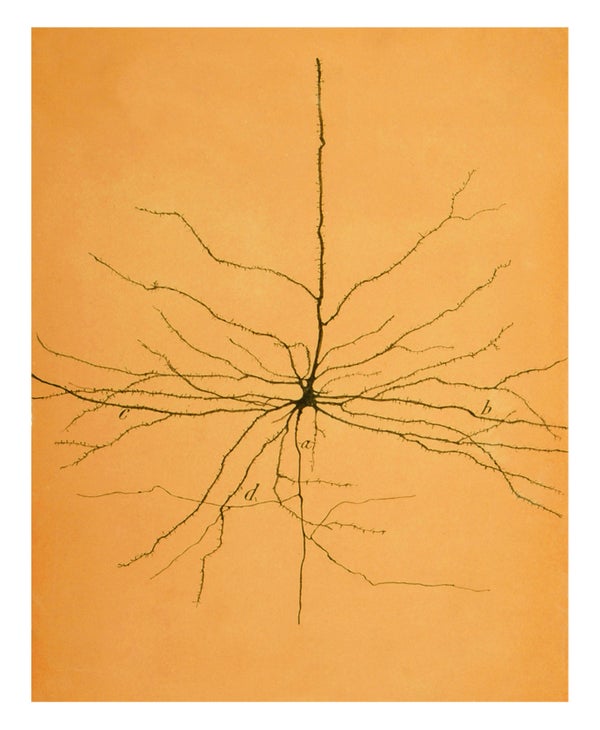
The hand-drawn sketches of Santiago Ramón y Cajal, the pioneering Spanish neuroanatomist, did much to establish the neuron doctrine for the brain. His drawings, exhibited at galleries the world over, gracing coffee-table books, T-shirts and the “inked” upper left arm of the first author (Koch), reveal the distinct nature of different cell types: Purkinje cells of the cerebellum with their coral-shaped dendritic trees; pyramidal cells of the cerebral cortex; and the layers of cells that tile the back of the eye.
On supporting science journalism
If you're enjoying this article, consider supporting our award-winning journalism by subscribing. By purchasing a subscription you are helping to ensure the future of impactful stories about the discoveries and ideas shaping our world today.
Through such laborious anatomical investigations, it became clear that there are many types of neurons in the brain. Each region, such as the retina, spinal cord, cerebellum, thalamus and cerebral cortex, the outermost layer of the brain that gives rise to perception, memory, thought, consciousness and action, has its own specialized complement of cell types, all working together harmoniously. Just like in any advanced economy, it is all about differentiation and integration.
This makes the nervous system radically different from the architecture of integrated electronic circuits, in which a handful of specialized transistor types, arrayed on flat structures containing fields of tens of billions of transistors, can implement any possible computation. Of course, bodies and brains self-assemble from a single fertilized egg in a lengthy, unsupervised process that takes nine months in utero and does not end until two decades later in mature adulthood, while computers are fabricated in their static final form under the rigid rules of industrial quality control and quality assurance.

Five types of excitatory neurons reside in the upper layers of human cortex. Modified from Berg et al. Nature 2021. Credit: Staci Sorenson
Exhaustively cataloguing all types of brain cells and characterizing their shapes, molecular constituents and input-to-output functions is of considerable academic and clinical interest. Many neurological diseases can be traced back to defects and vulnerabilities in specific types of cells. They include retinal blindness, such as retinitis pigmentosa and Leber congenital amaurosis; spinal muscular atrophy; Dravet syndrome (also known as severe myoclonic epilepsy of infancy); frontotemporal dementia; Alzheimer’s disease; and amyotrophic lateral sclerosis (also known as Lou Gehrig’s disease).
It is the need for such a cell inventory that prompted the U.S. BRAIN initiative, under the leadership of the National Institutes of Health, to establish the Brain Initiative Cell Census Network (BICCN) in 2017. Its aims are to identify all the different types of cells that make up the mammalian brain. BICCN is a far-flung collaboration among top researchers at U.S. universities and not-for-profit research institutes, funded by numerous large grants, three of which are led by Mike Hawrylycz, as well as the two last authors (Lein and Zeng), all from the Allen Institute for Brain Science.
BICCN and a distinct international effort called the Human Cell Atlas, which seeks to classify cell types in all organs making up the human body, are predicated on a powerful molecular technology, single-cell RNA sequencing, that has taken biology by storm.
Each cell carries within its nucleus the hereditary information that makes the organism what it is. Its DNA is a blueprint of how it will develop into its adult form. This is the organism’s source code, durable and redundant. However, while cells in an organism generally carry the same source code, a retinal cell differs from a Purkinje cell thanks to the actual genes that are expressed, or turned on, in that cell. Active genes are transcribed in a highly regulated process into the cell’s mRNA, its transcriptome (yes, the same type of mRNA that makes up the beating heart of mRNA covid vaccines). Think of RNA as volatile code that is executed at run time that translates the source code into actions.
Based on ongoing refinements in the sensitivity of next- generation technology, single-cell RNA sequencing (scRNA-Seq) reads out the expression profiles of all genes being used in thousands of cells. That involves about 20,000 protein coding genes and other noncoding regions of the genome, although any given cell only uses a subset of these transcripts. These can then be grouped using clustering algorithms into discrete types. scRNA-Seq is now the gold standard in biology and medicine, for surveys large and small, from freshly prepared samples tofrozen and archived tissue across many species. Both the sequencing and the analysis tools and methods keep on improving and dropping in cost.
scRNA-Seq can be combined with other modalities that reconstruct the dendritic tree or trace the path of the wirelike extensions from neurons’ cell bodies called axons as they wind their way across the entire brain. Still other techniques record the electrical response of neurons responding to injections of electrical current. Together, this suite of technologies provides an unprecedented, detailed and comprehensive view of the structure and function of cells.
Carried out in a standardized and systematic manner across hundreds of thousands of cells, the massive BICCN effort surveys the lay of the land, building an atlas of cortical cell types and how they vary across three species: mouse, marmoset monkey (found in South America) and human. The first fruits of the BICCN are now out in a packet of 17 articles published simultaneously in the international scientific journal Nature. This trove of data and metadata is available to anyone using dedicated browsers and viewers to further accelerate the discoveries of therapies. It is a massive effort with hundreds of authors.
The bulk of these papers focus on a highly specialized region found in all mammals called the primary motor cortex or M1. It is a strip of tissue extending in a left-right direction across the cortex, just underneath the crown of the head. This region represents a topographic motor map of the various body parts controlled by the brain, from toes to feet to hands and so on all the way to lips and mouth. In humans, primary motor cortex is characterized by the presence of exceptionally large cells, named Betz cells after the Ukrainian anatomist who described them, cells that send their axons all the way down to the spinal cord.
BICCN computational scientists applied various clustering algorithms to the mRNA transcripts expressed in cells from M1 to classify the cells, identifying about 100 different cell types. That is, cells could be sorted into one of a hundred different bins, with different groups of genes shared within each type. Aligning these groups across the three species examined gives rise to a consensus taxonomical tree, a representation like the one we’re familiar with from high-school biology textbooks when describing species. At the bottom are the leaves of this tree, 45 cell types conserved across the three species.
Depending on the amount of shared mRNA transcripts (ultimately, the shared executable code), M1 brain cells come in two broad varieties: neural and non-neural derived cells. The next split along the neural branch divides true neurons from glial cells. The group of eight glial and nonneural types includes oligodendrocytes, astrocytes and microglia cells, all critical to supporting and nurturing the neurons. The neuron group divides into 13 excitatory or glutamatergic and 24 inhibitory or GABAergic neuronal types, defined by the action they exert on their targets, either increasing or decreasing their propensity to be excited, that is firing action potentials.

A tree diagram shows cell types in the motor cortex found in humans, marmosets and mice. It is displayed as a taxonomy that separates cells into neuronal and nonneuronal cells. Then, moving down neuronal subbranches, there are excitatory (glutamatergic) and inhibitory (GABAergic) neurons. The former release chemicals called neurotransmitters that send an electrical impulse, an axon potential. The latter send out neurotransmitters that tamp down this activity. At the bottom of the diagram is a listing of specific cell types that are dispersed in different layers of the cortex. Modified from BICCN et al. Nature 2021. Credit: Nik Jorstad
GABAergic cells, in turn, are further divided up into six subclasses found throughout the depth of the cortical sheet, from the most superficial part (layer 1) all the way to its bottom (layer 6). They are also called local interneurons, as they tend to have a limited spatial reach, modulating and dampening the electrical activity of excitatory cells, most of which are so-called pyramidal neurons that send their output to regions beyond their local neighborhood.
Different glutamatergic excitatory neurons likewise segregate according to where they are located within the cortical sheet, that is, the layer in which their cell bodies are located (say, layer 2 versus layer 5) and where they send their information. They may send signals to other cortical regions, to the striatum, to the thalamus or to the spinal cord (gigantic Betz pyramidal cells, for example). Each cell’s mRNA expresses the zip code of the regions their output is targeting. The molecular transcript specifies the destinations in the dense terminology familiar to neuroanatomists: intratelencephalic- and extratelencephalic-projecting neurons or cortico-thalamic-projecting neurons.
A novel feature of these studies is that they measured both gene expression, using scRNA-Seq, and the state of the cell’s packaging material, or chromatin. The tighter the DNA is wrapped, the less likely a gene will be accessible to the transcriptional machinery—and this is measured using techniques called single-cell epigenomics. Perhaps not surprisingly, gene expression and gene regulatory architecture, reflected in the epigenomics data, are highly aligned. While the former provides insight into what genes are turned on, the latter, measuring the chromatin state of each cell, is more akin to the life history of the cell and, ultimately, its identity.
The question of how many naturally occurring elements make up the periodic table of chemistry has a precise answer: 92 (including byproducts of nuclear reactions). The question of how many types of brain cell types make up a brain does not. Given that each cell expresses thousands of different species of RNA molecules, it is always possible to discover finer and finer distinctions among cells. The underlying high-dimensional landscape is one of slowly changing gradients, on occasion interrupted by abrupt discontinuities, but no obvious periodic regularities. The situation may be analogous to the question of how many species exist.
Sure, by some measure, a Chihuahua and a Bernese mountain dog are both members of a single species, canis familiaris, but considering their coat, size and behavior, these two breeds could well be considered different species depending on the exact metric one adopts. And so it is with brain cells, which depend on the variant of scRNA-seq technology that measured the transcriptome and whether additional epigenetic, morphological, functional and other modality-specific criteria are used for the classification and exact parameter settings. But by all measures, even in M1 there are at least 50 cell types, with perhaps a few thousand types across the entire brain.
While many of the exact genes expressed in any one cell type differ among the three species, the overall similarities are astounding, with some types aligning one-to-one in all three species, even though the last common ancestor of mice, monkeys and people lived 60 million years ago. And yet, we will never have dinner conversation with a mouse or a monkey. It is the variation from these remarkable cross-species similarities that makes the difference. This includes not only minute differences in the genes expressed in the brains, but also the thousandfold increase in numbers of cells across these species. There is also variation in the way these genes are regulated and species-specific specialization in cell types. One of these Nature papers demonstrates that the mouse has three excitatory, glutamatergic cells in the upper layers of its cortex while humans have five.
Mammals evolved with a powerful mechanism, an extended cortical sheet of neurons and supporting cells, the most complex piece of active matter in the known universe, that made them the dominant group of vertebrates. Its detailed molecular architecture reflects, in a highly organized and lawful manner, its function.
Ed Lein and Hongkui Zeng were lead investigators on grants that produced the NIH Cell Census.
We thank Nik Jorstad and Staci Sorensen, both from the Allen Institute, for help with Fig. 1 and 2 respectively.